Planes, Trains, and Automobiles a Market Data Stream thats Free!

There is a ton of free marketing data you can get when putting together an online business that has to do with the vehicle industry. A couple of our eBay and Amazon stores deal directly with the automotive end user and would benefit from such data.
BEFORE THERE WERE TWO WAYS TO GET THIS DATA:
- The first was GUESS!
- And the second was to PAY for it.
But now there is a third way which is to not have to guess because it is from a reliable source, and not have to pay for it because this reliable source is FREE. And that my friends is the power of Census statistics. So for our little example here we will focus on some data sets that would help us in building our online business of selling automotive parts.
FIRST Data Set is the number of Workers 16 years and older. For instance there are almost twice as many of them in California then Florida and in my State there is over 1.2 million workers. So why is this important? Well if you think about it the driving age in our country is 16 years of age and if a persona has employment they just may have a car.
SECOND Data Set is Car, Truck, or Van. The number is pretty high as to how many workers have a car. In my state of the 1,249,915 workers over 16 years 1,101,421 have a vehicle. Furthermore to refine the data set 950.837 of those drove alone.
THIRD Data Set is Public Transportation. As you would have guessed, New York far outpaces everyone in the public riding public transit. Over 2 million of the 8 million workers do so. In my state only 29,804 ride, which means there is a lot of cars. Furthermore you can see how many rode a bike to work or walked. In the case of walking NY also leads in sheer numbers.
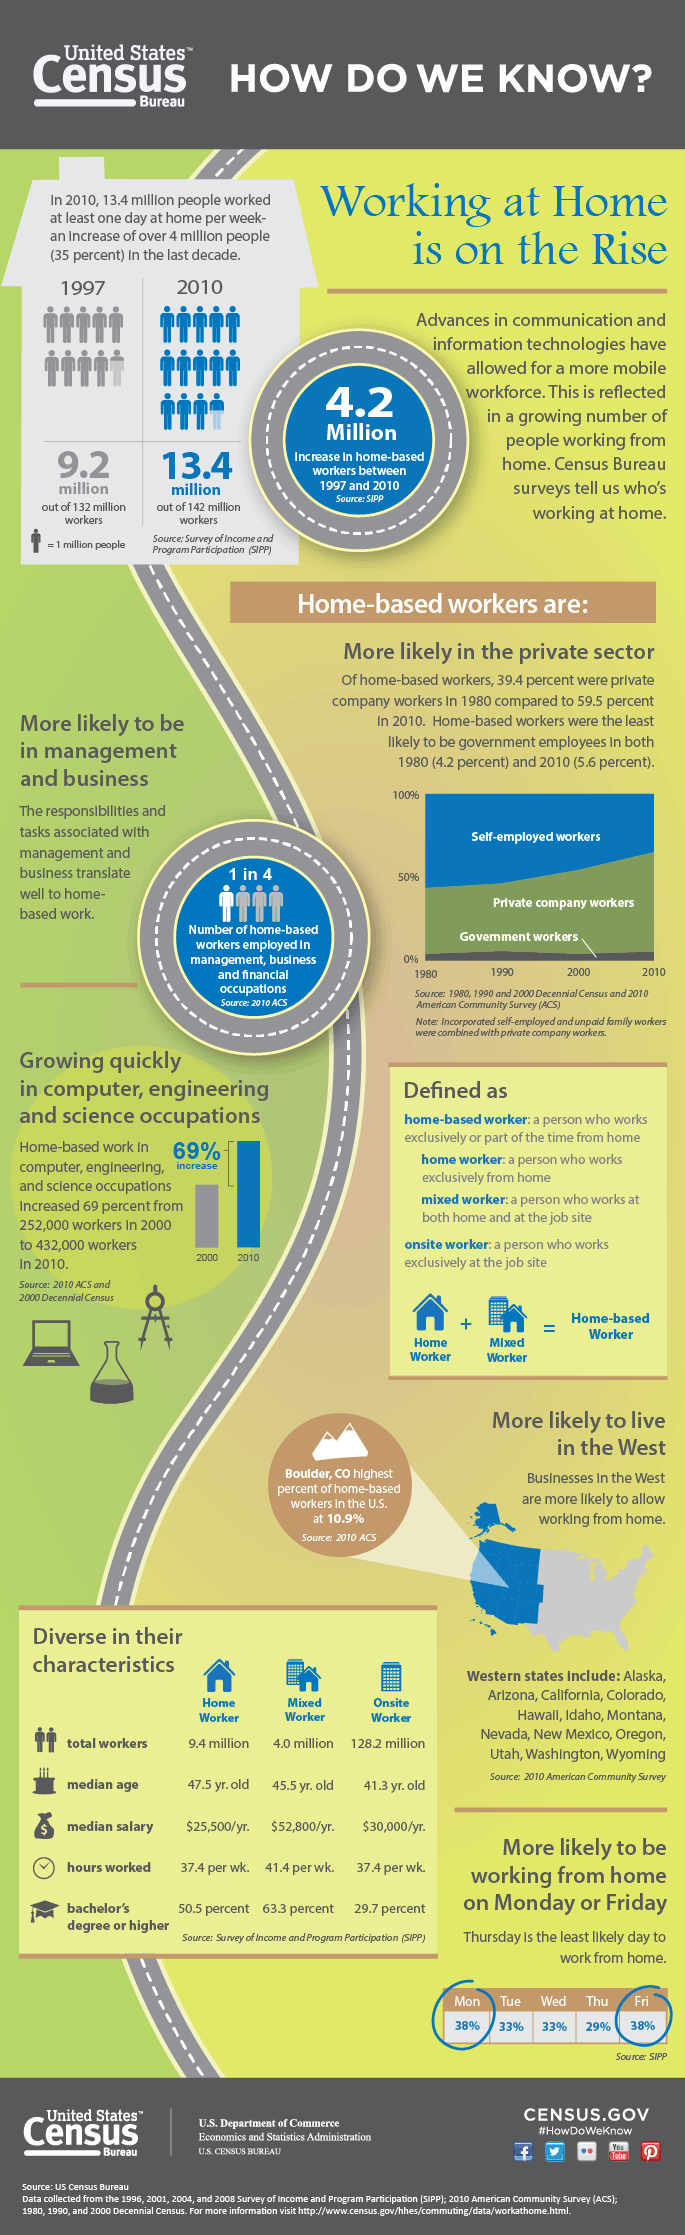
FOURTH Data Set is Working from Home. This is an important statistic if you are a home based online business provider. California leads the way with over 800,000 of their workers doing it from home. In my state fewer that 60,000 work from home of which I am one of those. But guess what I still own a vehicle, three as a matter of fact.
FIFTH Data Set is Commute Times. As you would guess California and NY lead in the amount of people who commute over 60 minutes in their car. Good if you are a radio station owner. North Eastern states have the highest average commute time with the upper West from Idaho to North Dakota with the least.
This is just an example of some of the data you can get, you can drill down and get even more data if you need it. All of it located here for your easy perusal.
IN FACT I CAN FIND OUT ALL KINDS OF FANCY STATISTICS:
- Most people leave work after 9:00 AM
- It takes most people less than 35 minutes to get to work.
- 42.2% of workers have access to at least 2 vehicle. 31.9% to three or more.
- More people work from home than those who commute by walking, bike, taxi.
- In a certain area households spend on average about $200 dollars in gas per month, $120 on insurance, $400 on car payments, and $50.00 on maintenance.
For more statistics on a variety of things you can look them up here. So what are you waiting for, if you need market data to make a presentation, a business proposal or plan, or an informed market strategy then go GET IT for free. You can also get some cool info-graphics as well.
Sponsored Links
[su_row][su_column size=”1/3″]AmazonBasics High-Speed HDMI Cable – 6.5 Feet (2 Meters) Supports Ethernet, 3D, and Audio Return[su_divider top=”no” size=”5″ margin=”5″]AmazonBasics Head Strap Camera Mount for GoPro
[su_divider top=”no” size=”5″ margin=”5″]Fire HD 7, 7″ HD Display, Wi-Fi, 8 GB – Includes Special Offers, Black
[/su_column] [su_column size=”1/3″]Samsung 64GB EVO Class 10 Micro SDXC up to 48MB/s with Adapter (MB-MP64DA/AM)
[su_divider top=”no” size=”5″ margin=”5″]Samsung Galaxy Tab 4 (7-Inch, White)
[su_divider top=”no” size=”5″ margin=”5″]Dirt Devil Scorpion Quick Flip Corded Bagless Handheld Vacuum, SD20005RED
[/su_column] [su_column size=”1/3″]Soundpeats Soundbeats QCY Qy7 Mini Lightweight Wireless Stereo Sports/running & Gym/exercise Bluetooth Earbuds Headphones Headsets W/microphone for Iphone 5s 5c 4s 4, Ipad 2 3 4 New Ipad, Ipod, Android, Samsung Galaxy, Smart Phones Bluetooth Devices (black/green)
[/su_column][/su_row]